One of the most inspiring parts of the music industry is when passionate, new artists get their break, make it big, and express their sound. For many industry-people, the joy and excitement around that journey is what got them into the music industry in the first place. For others, that is what fuels them day by day.
The digital streaming era has made it easier than ever for new artists to make and release music. At the same time, it has made it harder than ever for managers, marketers, and A&R scouts to keep track of what is happening across the entire digital music landscape. Increasing amounts of data on unprecedented amounts of aspiring artists make it hard to identify the stand-outs.
Finding a rising star today is like Where’s Waldo on steroids.

A&R scouts and managers know that identifying the next big artist requires industry savvy, forward thinking, and hard work. Doing so requires skills that cannot be replicated with artificial intelligence (A.I.). We are nowhere near a point where A.I. could replace the talented people in A&R.
But A.I. still has a big role to play. One of the main goals of artificial intelligence is to tackle bogglingly large-scale problems. And a “bogglingly large-scale problem” is exactly what the music industry is facing right now. For example, on Spotify alone 40,000 new tracks are added every single day. That says nothing about the talent emerging on Soundcloud, Apple Music, YouTube, Deezer, Amazon, Instagram, and TikTok.
Chartmetric’s goal is to build tools to empower A&R scouts, not replace them.
We don’t want to tell you who the next big artist is. We want to help you focus your expertise, time, and energy in the most promising directions.
“What does A&R empowered with machine learning look like?”
Imagine if a tool could help you filter the overwhelming landscape of aspiring artists down to a “short list” of the artists that have what it takes to succeed. Imagine further that you can choose to cast either a wider or a narrower net. You could decide how much of an artist’s history to take into account: Do you look for artists that are literally just starting out? Or do you target musicians that have already started showing a consistent ability to release tracks and gain listeners?
Whatever strategy you favor, our new Predictive A&R tools make that hypothetical a reality, and you can use them right now, over at Chartmetric.com!
These tools don’t just look back at the past, they make active predictions about the future.
Our new A&R tools filter through 1.7 million artists to return the top results for artists that are most likely to have a big career break in the next 7 days.
On our site currently, you can customize the type and breadth of your search, sort by region and genre, and filter artists that are signed by major labels (in case you’re looking to sign talent or want to find an up-and-comer to collaborate with). Checking out an artist’s full profile, including direct links to their music, is always just one-click away via Chartmetric’s artist page.
You can see what it looks like here:
Alright, so that seems pretty cool! But how did we actually build it? How does it work?
Per usual, even the most seemingly complex machine learning processes can be broken down into fairly simple and logical steps.
- Define Successes: We have to identify artists that have “made it” so that we can learn from them.
- Identify Common Patterns: We identify patterns shared within those artists’ histories. You can also think of this as establishing “profiles” for what breaking artists look like.
- Compare New Artists to Those Success-Patterns: After that, we can set up a pipeline to grab artists’ recent stats and see when they start to exhibit patterns like the artists we saw that already “broke.”
That short description belies a lot of work, of course. So let’s briefly go through each of those steps to better understand what the process looks like.
Step One: Define “Successful” Artists
The very first thing we need to do is create a category of artists that we want to identify with our model.

There’s a famous, and often cited, example of a ML project to classify images with tanks from images that did not have tanks. By inadvertently feeding the model pictures of tanks taken on sunny days and tankless pictures from non-sunny days the researchers had actually trained a model to distinguish sunny days from non-sunny days. For a more recent but less evocative example, you can read about how this 2nd place Kaggle winner realized that while building a whale-classifier he had actually inadvertently built an ocean-waves-classifier instead. Oops!
The takeaway? ML models will lock on to the commonalities of what you feed them. So you need to be incredibly thoughtful, rigorous, and critical when working with your data.
This is the hardest, and most crucial, stage of the entire process. The quality of your machine learning model’s results is a direct consequence of the quality of the data you put into it.
So we need to pick “successful” artists with a lot of care. I’ll skip a lot of the nitty-gritty here because it gets technical quickly and we could write a full-length article just on this process… but here are the major takeaways:
- We wanted to get a sense of the likelihood for an artist to break, so classifiers seemed like the way to go. That means we had to break all artists into just two groups: Successes and Still-Aspiring-Artists.
- We looked at all artist histories that we have in our database over the past 3 years. It didn’t matter if the artist broke 4 months ago or 2 years ago. Everyone was welcome to compete.
- We exclude artists that are already successful based on a number of factors. We don’t want our model to “discover” Ariana Grande. That would be about as revolutionary as saying you “discovered” the sun… No one would be impressed.
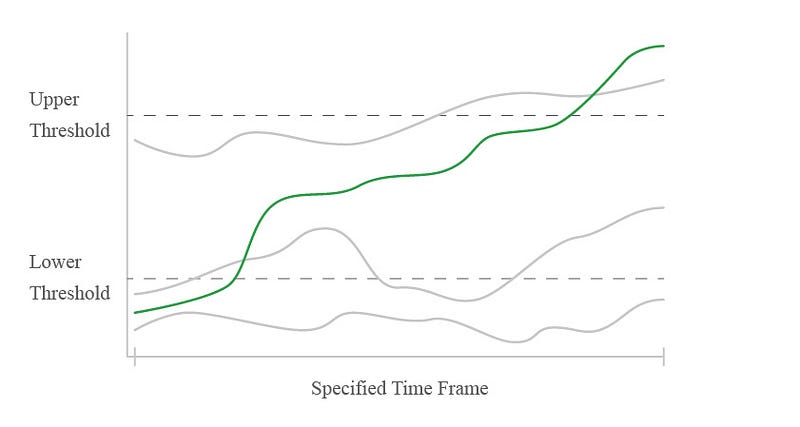
- We set a numeric threshold that we considered to be a notable-level of success (“Upper Threshold”). Any artist that started below a certain point (“Lower Threshold”) and then passed the Upper Threshold within a Specified Time Frame made it through the first round of filtering.
- We wanted artists that “made it” and then stayed there. The second stage of filtering excluded a number of undesirable patterns: “15-minute of famers” that fell back into obscurity quickly, artists that rose and fell repeatedly, and many more.
- Because the best upper-threshold for success is subjective (largely varying based on the type of artists you want to find), we created multiple versions. Users are able to pick the thresholds that they feel are the most effective for their use-case.
Step Two: Identify Successful Artists’ Shared Patterns
Whenever we identified a success case, we looked at the 6 months of historical data leading up to that point. We gathered together a number of performance metrics from Spotify, Instagram, and each artist’s release schedule as well.
The historical trends tended to look something like this:


The “secret sauce” to make this method excel is that we do not want to be so strict in identifying success cases that we end up requiring artists to conform to restrictive paths to success. If we did that, we would essentially become so narrow-minded that we would ignore up-and-comers just because we didn’t like how they were growing. In today’s shifting music market, and with so many new emerging mediums like TikTok, we want to be as open-minded as possible.
For example, take a look at the difference between how Billie Eilish and Lil Nas X grew their careers.
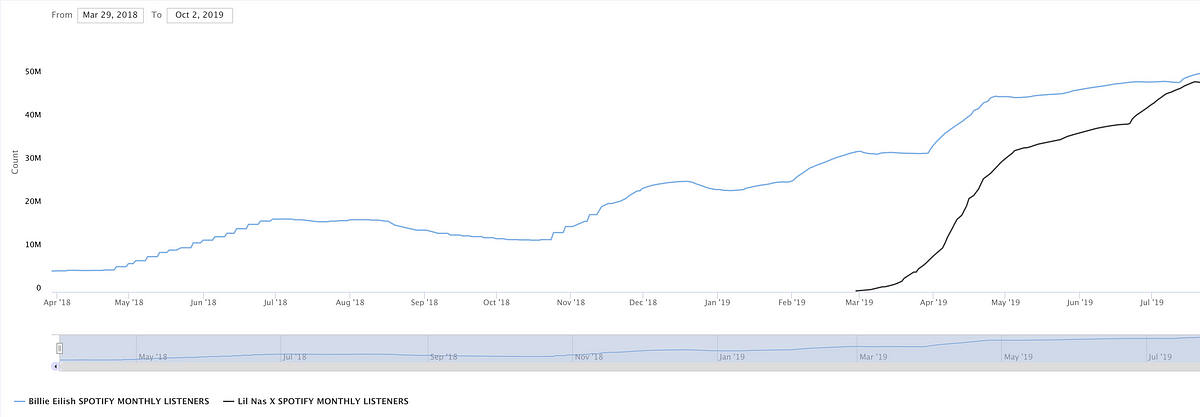
Already we can see that we have a lot to learn from the stories of both Lil Nas X and Billie Eilish. They had very different paths to success. Similarly, we probably have a lot to learn from hundreds of thousands of other artists’ experiences.
The most accurate way to make predictions is to look at a wide range of cases, and then start paying attention to which patterns most reliably lead to positive outcomes. That way when we see new cases, we can compare them to what we have already seen and then assess how confident we are about making a prediction.
That is exactly how our machine learning models operate.
We spent a lot of time and energy identifying between 8,000–10,000instances of artists’ career break-outs to learn from. But we also compared to tens of thousands of cases where artists did not have career break-outs, to find the patterns that distinguished each group.
Chartmetric’s database holds more than 271 million data-points on artist streaming data going back to 2017.
We drew on all of it.
Step Three: Compare Patterns of Current Artists
Most simply, we start by looking at a current artist. Then we think back on the masses of artists that we’ve learned about, and compare how similar they all are.
Out of all the artists that had patterns similar to this current artist, how many of them had a big career break in the near future? 10% of them? 100% of them? Or was it more 50/50? The more artists that went on to be successful, the more confident we can be that this artist will too.
Here is an illustrative example:
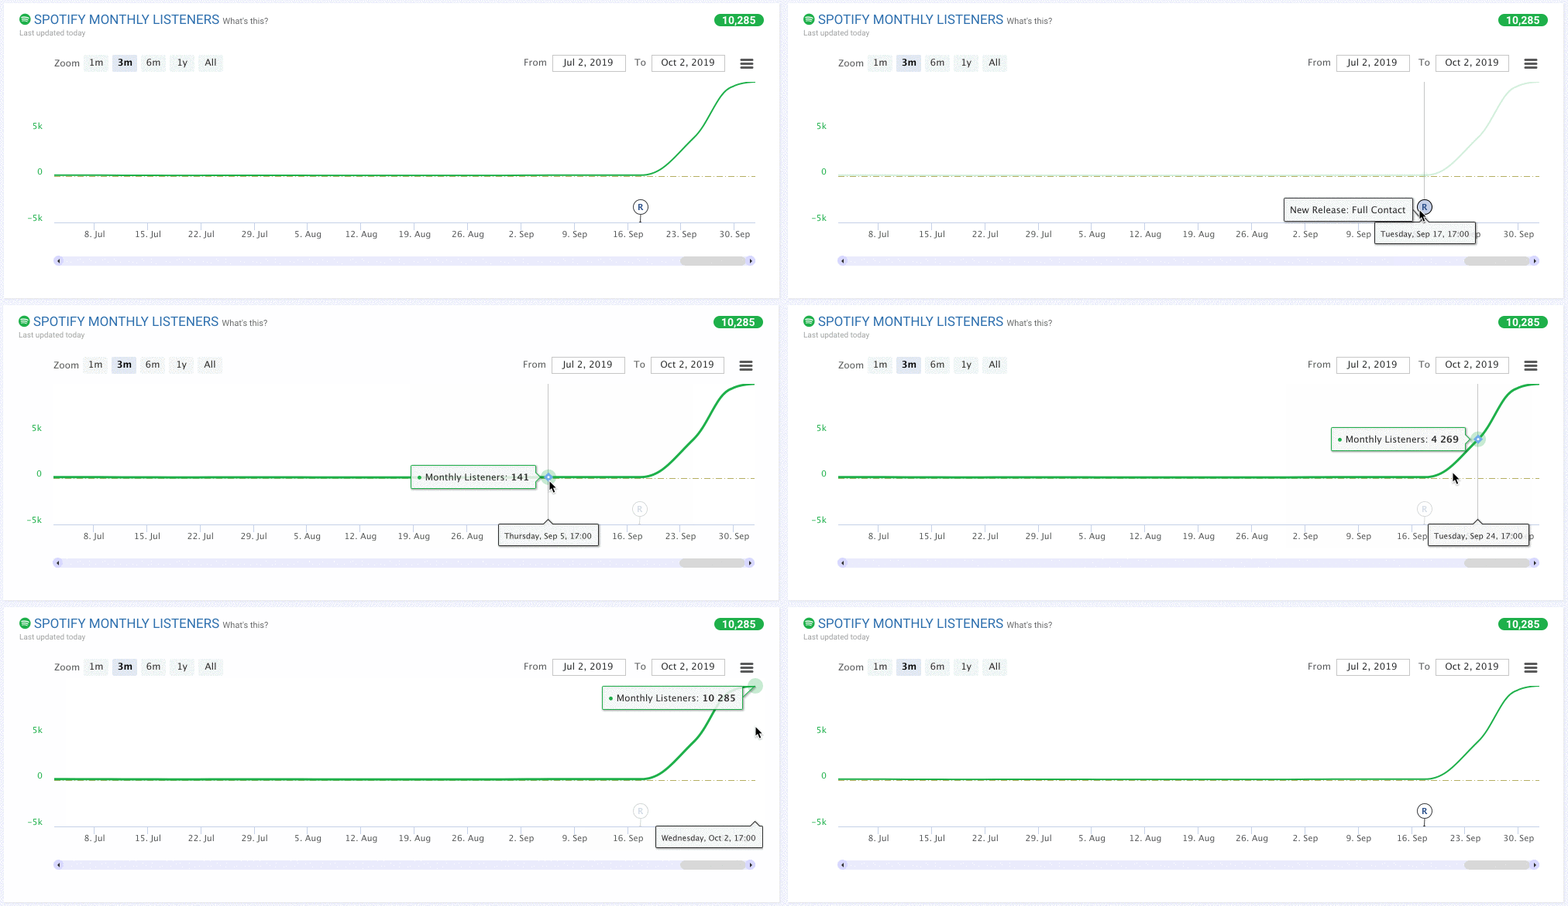
Based on what we’ve seen in the past, we can give each artist a symbolic “thumbs up” or “thumbs down” and we can also say how confident we are in our assessment.
The graph above looks pretty promising, right? The recent release as well as a surge in listenership gives us more confidence that we can give this artist that symbolic “thumbs up.”
Let’s compare that to another artist with stats that are less positive:
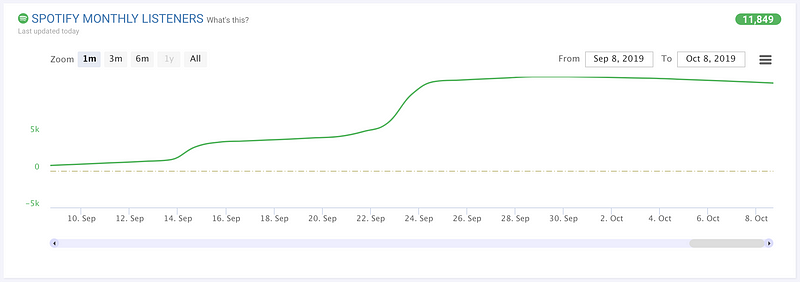
This artist is at a cross-roads of sorts. Lots of artists peak and then fall back. Other artists have moments where their stats level off, but then they release again, or tour, or do a collaboration and then their stats take off and rise again even higher.
This artist could go either way. So if we were smart, we would have more reservations about predicting one way or the other. Because our models order artists by how certain we are that they could continue to rise, in-between cases like this one get pushed further down the list. Eventually, if our certainty is low enough then the artist gets dropped off the list completely.
One of the most handy features of a classification model is that we intelligently infer the certainty of our predictions based on real-world data — not on anecdotal evidence or our personal biases.
That’s essentially the definition of data-driven decision making.
Check Out Brand New Up-and-Comers!
We deploy these models every single day to filter the overwhelming number of artists into a shortlist of artists that are making waves in the music scene.
You can further refine each day’s results by filtering on region and genre, as well as excluding or including artists signed by major labels. Beyond that, it is easy to learn more about any artist with one click by heading to our artist pages, or you can go directly to their social media and streaming platforms.
Just remember, we did not build these tools to tell you which artist is going to be the next big hit. We built these tools to help filter the millions of artists in the way you think is best so that you can discover new sounds, new talent, and new stories.
Predictive A&R is a paid feature, but you can grab a free trial for Chartmetric to explore many of our services here.


